Can the Sumerian King List Remember Ancient Climate?
 by ahsan
August 29, 2026
6 min read
by ahsan
August 29, 2026
6 min read
A seductive set of numbers
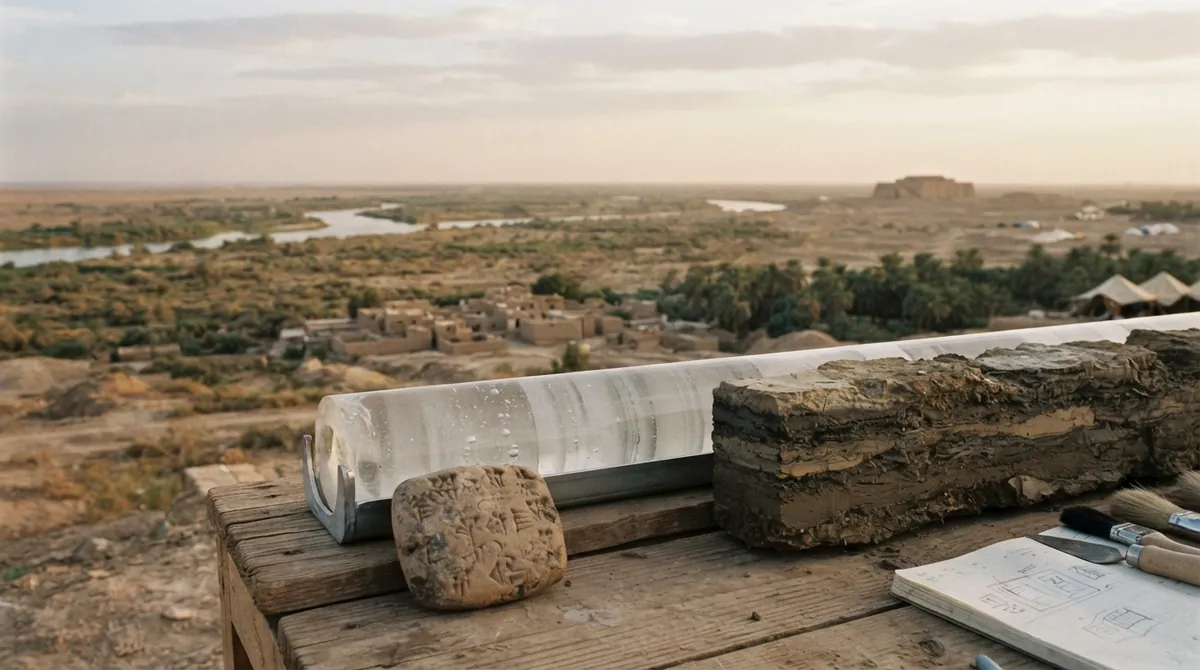
A row of numbers on a clay tablet can be more seductive than a row of stars. The antediluvian section of the Sumerian King List—antediluvian means before the flood—opens with eight rulers whose reigns last 28,800, 36,000, 43,200, and other astonishingly large numbers. Together they total 241,200 years. Several values are tidy multiples of 3,600, while every reign is divisible by 600. The pattern looks designed rather than bureaucratic. (cdli.earth)
That regularity invites a daring idea: perhaps the reigns are not literal biographies at all, but a distorted memory of environmental change. Rescale the sequence, place its flood boundary near a known climate transition, and the reign boundaries might line up with ice-core signals, abrupt cooling, eruptions, or sea-level shifts.
The real question is not whether a few matches can be found. It is whether the original order looks more impressive than random orders built from the same numbers. That distinction turns an ancient-history puzzle into a statistics problem.
Turn reigns into a timeline
The first step is a coordinate conversion, not a claim about history. We treat the 241,200 listed years as a 241.2 ka span, where ka means thousands of years. Then we anchor the final boundary—the point immediately after Ubara-Tutu—at 11.6 ka BP.
BP, or before present, uses 1950 as its conventional reference point in archaeological and geoscientific dating. The 11.6 ka choice sits near the end of the Younger Dryas, a late-glacial cold reversal generally placed around 12.9 to 11.7 ka BP. Its timing and expression vary across regions and climate records, so it is better understood as a transition with a history than as one universal timestamp. (pubs.usgs.gov)
Most importantly, the King List does not provide the 11.6 ka date. The analyst chooses it. That makes the date an experimental anchor, not a prediction extracted from the tablet.
A short Python calculation makes the transformation visible:
import numpy as np

reigns = np.array([28800, 36000, 43200, 28800,
 36000, 28800, 21000, 18600])
anchor_ka_bp = 11.6

elapsed = np.r_[0, np.cumsum(reigns)]
boundaries_ka_bp = anchor_ka_bp + (reigns.sum - elapsed) / 1000
print(boundaries_ka_bp)
# 252.8, 224.0, 188.0, 144.8, 116.0,
# 80.0, 51.2, 30.2, 11.6
Eight reigns create nine boundaries: the beginning, seven internal boundaries, and the end. Nothing climatic has been demonstrated yet. We have only placed an old sequence on a modern time axis.
Climate archives are not one perfect clock
Paleoclimate evidence comes from proxies, natural records that stand in for direct measurements. Ice layers can preserve clues about temperature, dust, volcanic activity, and atmospheric gases. Pollen in lake sediments can reveal changing vegetation, while ocean sediments can record shifts in water conditions and biological communities. (ncei.noaa.gov)
These archives are powerful, but they do not all measure the same thing. One event label may describe the onset of cooling, another its coldest phase, and a third the eventual recovery. Each record also carries dating uncertainty. A catalog containing many events therefore creates many chances for a boundary to land nearby, especially when the matching window is wide.
Score closeness without declaring victory
A hard cutoff would count an event two thousand years from a boundary and ignore one two thousand years plus a day away. That abrupt yes-or-no behavior is awkward for dates that already have uncertainty, so the analysis uses a Gaussian kernel.
A kernel is a rule that converts distance into weight. Here, the weight for an event-boundary pair is:
weight = exp(-(distance ** 2) / (2 * sigma ** 2))
The sigma value is the bandwidth, or the scale that controls how quickly the weight fades. An exact match contributes one point. A match one sigma away contributes about 0.61 points, and a distant event contributes almost nothing. The analysis tests sigma values near 0.80 and 1.60 ka, calibrated to behave roughly like hard windows extending one or two thousand years on either side of a boundary.
A second measure counts binary hits inside a fixed window, but the smooth kernel score is the main statistic. It preserves more information about near misses instead of treating every event inside a window as identical.
Shuffle the reign order
To test whether the Sumerian order is unusual, keep the eight reign lengths and the climate catalog fixed, then shuffle the order of the lengths. This is a null model: a carefully defined picture of what the data might look like if the proposed relationship were absent.
The analysis evaluates 8! labeled arrangements, or 40,320 possible orders. A permutation test compares the observed score with those shuffled scores. Its p-value is the fraction of random arrangements that score at least as highly as the observed arrangement. It is not the probability that the King List is true, nor the probability that a flood happened. It answers the narrower question of whether this order is unusually well aligned under the chosen rules. (docs.scipy.org)
At the fixed 11.6 ka anchor, using the primary paleoclimate catalog and sigma = 1.60 ka, the observed kernel score is 6.075 and the permutation p-value is 0.350. Roughly 35 percent of the shuffled orders perform at least as well. That is not an unusual result.
Adding a wider catalog with 103 usable entries produces more apparent matches, as expected, but the p-value falls only to 0.148. The best raw result appears in a deliberately catastrophic exploratory catalog, where p = 0.021. That number sounds interesting until the full search is counted. After adjustment for the tested catalogs, bandwidths, and chronologies, the Benjamini-Hochberg adjusted value is q = 0.222. A q-value is a p-value corrected for multiple comparisons; it reflects the fact that a large search can produce a small result by chance.
What happens when the anchor moves?
The fixed-anchor test is fairly strict: 11.6 ka is chosen before scoring and then held in place. A separate browser sweep allows the anchor to slide from 10 to 13 ka. The best position occurs at 13.0 ka, where the score rises to 6.838. A Monte Carlo exceedance estimate—the result of repeatedly sampling random anchor windows—is 0.147.
That improvement is useful as a sensitivity check, but it is not new evidence. Choosing the best anchor after inspecting the curve is another comparison to account for. This is the look-elsewhere effect: the more locations, bandwidths, catalogs, and chronologies we try, the easier it becomes to find an attractive peak. The fact that the best anchor sits at the edge of the selected 10–13 ka window is another reason to avoid presenting it as a discovered date.
What would count as stronger evidence?
A more persuasive test would need several decisions made before the matches were inspected:
- The anchor would come from the text or from independent evidence, rather than an analyst-selected climate date.
- The event catalog, dating uncertainties, and meaning of each event would be fixed in advance.
- The null model would be stated clearly, including how repeated reign lengths are treated.
- Every tested chronology, catalog tier, bandwidth, and anchor range would be reported.
- A separate catalog or region would be reserved for validation rather than used to search for the best result.
Comparing the same procedure with Biblical patriarchal ages, Manethonian god and demigod reigns, or post-flood Kish rulers can illustrate how easily unrelated chronologies generate near matches. Those comparisons are demonstrations of flexibility, not independent statistical controls.
The result is a lesson in method
Under the fixed 11.6 ka setup, the Sumerian King List does not show a statistically significant alignment with the primary paleoclimate catalog. The result does not prove that ancient stories contain no memory of environmental disasters. It shows something narrower and more useful: this particular order of enormous reigns does not outperform shuffled versions once the search choices are counted.
The numbers remain fascinating. Their repeated multiples and flood-era structure tell us something about how ancient chronology could be shaped into a meaningful story. But a visually pleasing timeline is the beginning of an investigation, not the evidence that ends it.
Comments (0)
No comments yet. Be the first to respond!
Leave a Comment
Your comment will be visible after review.