Interpreting Japan’s JMA “Seismic Intensity 7” from a 7.1 Quake
 by ahsan
July 28, 2026
5 min read
by ahsan
July 28, 2026
5 min read
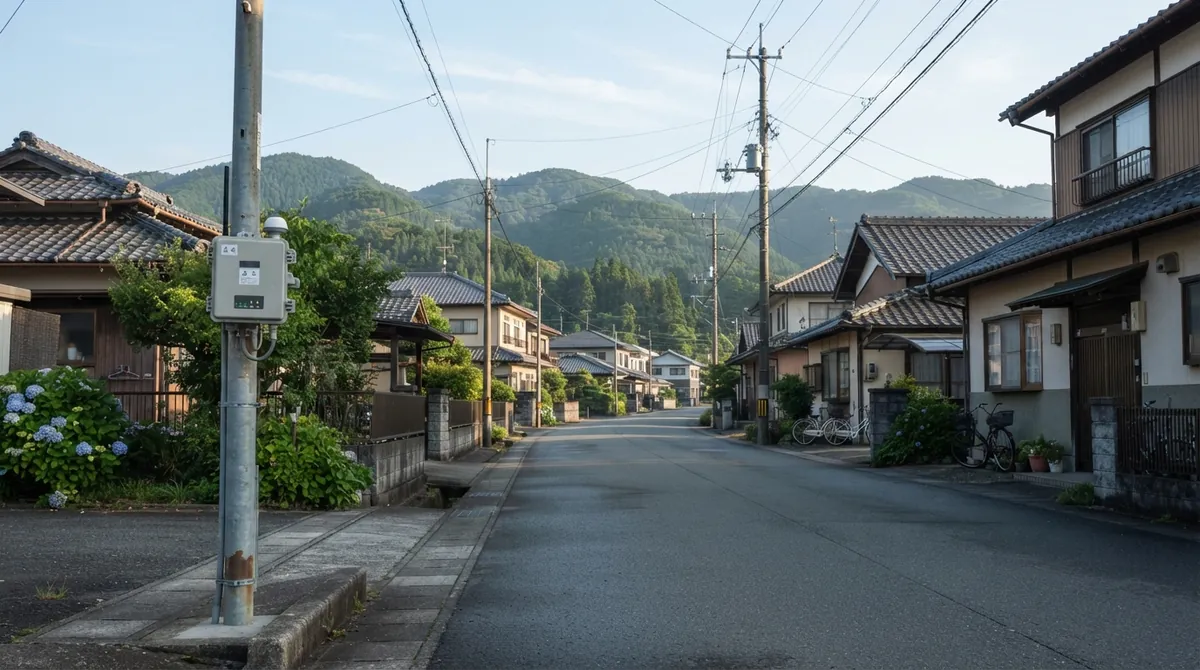
The moment you see “7” on the Japan map
A quake hits Japan, and within minutes a map starts circulating: colors, numbers, and a list of towns. In this case the headline is Earthquake 7.1 (Kumamoto region), with JMA seismic intensity reaching 7 in Uki City and Hikawa Town. (data.jma.go.jp)
If you’re encountering this for the first time, the confusing part is that these numbers aren’t “damage reports” and they aren’t “how big the earthquake is” either. They’re how strong the shaking was at specific places. That distinction matters, because two neighborhoods only a few miles apart can show different intensity levels on JMA’s reporting. (jma.go.jp)
Magnitude vs. seismic intensity (why two numbers exist)
Earthquake magnitude is a single number meant to describe the earthquake’s size at its source. Seismic intensity is different: it measures how strong the shaking feels/impacts at a particular location. An earthquake can have one magnitude but many intensities across a region. (usgs.gov)
That explains the psychological trap people fall into: a magnitude 7.1 sounds like it should “mean the same thing everywhere.” But intensity depends on things like:
- distance from the rupture (epicenter/hypocenter)
- local ground conditions and geology
- how the wave “shapes” itself on the way to your town ()
What “JMA seismic intensity” actually measures
In Japan, the Japan Meteorological Agency (JMA) uses a specialized scale called the JMA Seismic Intensity Scale. It’s based on readings from seismic intensity meters placed on the ground (or on the first floor of low-rise buildings). ()
JMA reports intensities in 10 categories: 0 to 4, plus 5 lower / 5 upper / 6 lower / 6 upper, and then 7. (data.jma.go.jp)
Why the scale can vary even inside the same city
JMA explicitly notes that seismic intensity is observed at the site where a meter is installed, so it can vary even within the same municipality. The same earthquake can also shake different floors differently within the same building. ()
So when you see a town listed under intensity 6- or 5+, it’s not a rumor. It’s a measurement category tied to sensor-based observations.
What does “seismic intensity 7” mean?
What does “seismic intensity 7” mean on the JMA scale? This is the part that turns numbers into reality.
JMA’s typical descriptions for intensity 7 include:
- Most unsecured furniture moves and topples, and it may even be thrown through the air.
- Wall tiles and windows are even more likely to break and fall.
- Reinforced concrete-block walls may collapse.
()
The technical takeaway for a beginner is not “everything collapses everywhere.” It’s that intensity 7 corresponds to violent shaking with a high likelihood of serious non-structural failures (furniture, tiles, windows) and some structural damage, depending on construction details. ()
Decoding the JMA earthquake page for this event
JMA reporting is structured like a timeline plus a geometry snapshot.
From the information associated with this M 7.1 event:
- JMA notes an observed earthquake time and location details (latitude/longitude), with an epicentral depth of about 10 km and magnitude 7.1. ()
- The event’s “issued” timestamp shows when JMA published the earthquake information—useful because their system is designed for speed. ()
A common beginner confusion is mixing up these terms:
- Hypocenter: the actual rupture focus underground (where seismic waves originate).
- Epicenter: the point on the Earth’s surface directly above the hypocenter.
JMA’s maps and lists are tied to intensity observations across municipalities, not just a single point.
How to read the municipality table without getting lost
The long table of municipalities looks overwhelming at first: prefectures, intensity levels, and many town/city names.
Here’s the practical way to interpret it:
1. Start with the top of the scale (7, then 6+ / 6-, etc.).
2. Treat each intensity band as a “range of shaking severity,” not a binary threshold.
3. Remember the “1 or more” logic: many places can feel some shaking even if it wasn’t severe.
For this earthquake, the reported maximum is intensity 7 in:
- Uki City
- Hikawa Town (data.jma.go.jp)
Then 6+ appears across multiple areas in and around Kumamoto, including major city wards and neighboring cities (for example Minami Ward (Kumamoto), Yatsushiro City, and Uto City are among those listed in the provided event data). ()
6- is also listed for additional nearby municipalities, showing how quickly shaking severity can drop with distance and local ground conditions. ()
Why the numbers spread so far
With a magnitude around 7, you might expect the strongest intensity to cover a wide region. Instead, the reported intensities form patches. Two reasons explain that pattern:
1) Ground conditions change the shaking
JMA highlights that seismic intensity is influenced by underground conditions and topography, and it can vary even within the same city. ()
So soft sediment basins can amplify shaking compared with harder bedrock slopes.
2) The wave doesn’t arrive as one uniform “hit”
Real seismic waves have different components and frequencies. Some structures respond more to certain periods of motion, and intensity meters effectively summarize that complex motion into a category.
JMA’s speed: why the information comes quickly
Another beginner-friendly detail: JMA doesn’t wait until everything is fully analyzed.
JMA’s published guidance describes a fast issuance pipeline. Seismic intensity information can be issued within about two minutes, while the location and magnitude are determined within about three minutes after the quake. ()
They also explain that they use observation networks and produce items like shake/intensity maps that account for local geological conditions and observed intensity. (jma.go.jp)
That’s why the map you see online is not “guesswork after the fact.” It’s the first pass of sensor-based reporting.
A final way to think about the map
When you see a JMA intensity map for an Earthquake in Japan—especially one with magnitude 7.1—treat it like a translation layer.
- Magnitude tells you the earthquake’s overall size.
- Seismic intensity tells you what the ground motion was like at your place on that morning/afternoon.
- Municipality listings are the measurable footprint of that shaking, captured by dense sensor coverage.
Even if you never study seismology, this is the technical literacy that makes the whole reporting system click: the same earthquake can be different shaking experiences, depending on where the waves travel and how the ground shapes them. ()
Comments (0)
No comments yet. Be the first to respond!
Leave a Comment
Your comment will be visible after review.